
Profiling is good. Errrrm, it’s good for debugging the performance and runtime of a Java app, in particular the functions that the CPU spends most of its cycles in.
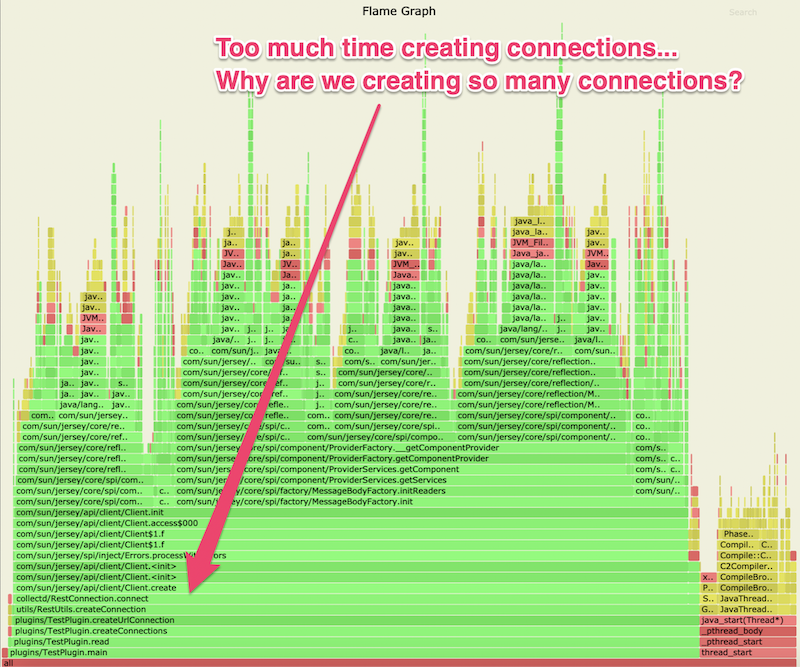
We recently had a customer filed bug where CPU usage for a particular java based process would rise above 100%. We were able to reproduce the issue – good news. We now wanted to assess where most CPU time was spent. Flame graphs to the rescue!
async-profiler for java was quick to set up and to use. Can’t recommend it enough. Give it a shot!
Before
After
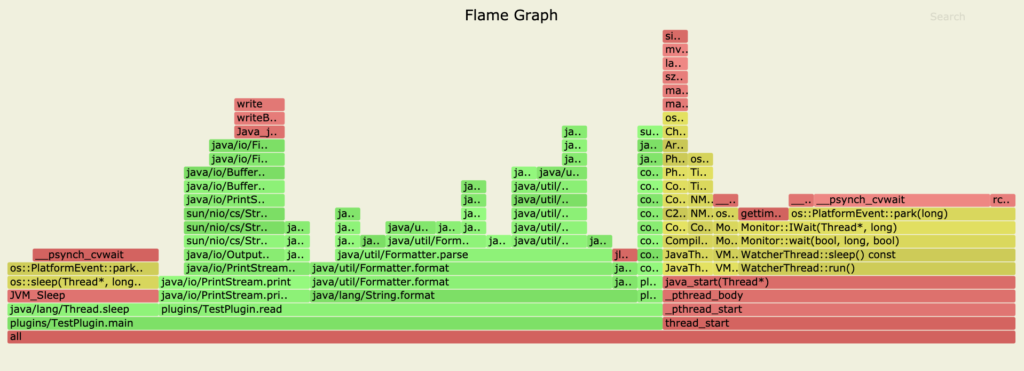
We quickly saw that we were creating too many connection objects. We believed instead that we had a collection pool of 2 connections, which would be re-used. This was not the case. After fixing the issue, we were able to quickly validate the fix via the async-profile generated flame graph.
Sample usage
$ jps
9234 Jps
8983 Computey
$ ./profiler.sh -d 30 -f /tmp/flamegraph.svg 8983
Check it out on github
Recent Comments